Table of Contents
Introduction
In today’s digitally interconnected world, understanding how data travels across the internet is vital. This article delves into the fascinating realm of tracing a route, specifically focusing on the intriguing tool known as Traceroute. Whether you’re a curious internet user or a network administrator, knowing how to decipher the path data takes from your device to a website or server is a valuable skill.
Understanding Tracing a Route
Tracing a route is all about unveiling the journey data packets make across the internet. It involves understanding the path, the intermediary points (hops), and the time it takes for a packet to reach these points. This information is invaluable for identifying network issues, latency problems, and congestion points.
How Traceroute Works
Traceroute works by sending a series of data packets with incrementally increasing Time-to-Live (TTL) values. As these packets traverse the network, each router they encounter decrements the TTL. When the TTL reaches zero, the router sends an ICMP Time Exceeded message back to the source, indicating that the packet couldn’t proceed further. This process is repeated with increasing TTL values, creating a map of the network’s path.
Your Computer
   |
   V
Router 1 (TTL=1)
   |
   V
Router 2 (TTL=2)
   |
   V
Router 3 (TTL=3)
   |
   V
...
   |
   V
Target Server (TTL=0)
In this basic representation:
- “Your Computer” represents the device from which you initiate the Traceroute.
- “Router 1,” “Router 2,” “Router 3,” and so on represent the intermediate routers or hops along the network path.
- “TTL=1,” “TTL=2,” “TTL=3,” and so on indicate the Time-to-Live value assigned to each packet as it travels through the network. This value decreases at each hop until it reaches 0.
- “Target Server” represents the final destination (e.g., a website server) that you are tracing the route to. When the TTL reaches 0, the target server sends an ICMP Time Exceeded message back to your computer.
Running Traceroute in Cisco Router
If you’re a network administrator working with Cisco routers, you can run Traceroute using the following command:
Router# traceroute [destination]Replace “[destination]” with the IP address or domain of the target. The router will then display a list of hops with their round-trip times, providing insights into the path taken by your data.
Running Traceroute in Windows CLI
For Windows users, Traceroute can be executed from the Command Prompt. Run the following command:
tracert [destination]Similar to the Cisco router command, replace “[destination]” with the target’s IP or domain. Windows will present you with a list of hops and their respective round-trip times.
Tracing My Internet Connection
Have you ever wondered how your data travels from your device to the websites you visit? Tracing a route can provide insights into this journey. By running a Traceroute, you can see the various hops your data makes before reaching its destination.
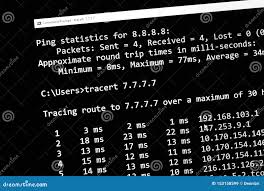
C:\Users\user123>tracert 8.8.8.8

Tracing route to google-public-dns-a.google.com [8.8.8.8]
over a maximum of 30 hops:

  1    <1 ms    <1 ms    <1 ms  my-router.home [192.168.1.1]
  2     5 ms     4 ms     1 ms  isp-gateway.local
  3     5 ms     6 ms     7 ms  gateway.provider.net
  4     4 ms     4 ms     3 ms  data-center-node.local
  5     6 ms     4 ms     5 ms  backbone-server.provider.net
  6    14 ms     3 ms     4 ms  high-speed-router.provider.net
  7     6 ms     4 ms     4 ms  internet-hub.provider.net
  8     *        *        *     Request timed out.
  9     *        *        *     Request timed out.
 10     *        *        *     Request timed out.
 11     *        *        *     Request timed out.
 12    31 ms    28 ms    30 ms  international-gateway.provider.net
 13   155 ms   164 ms   154 ms  transatlantic-cable-provider.net
 14   151 ms   152 ms   151 ms  data-center-London.provider.net
 15   159 ms   157 ms   160 ms  google-dns-server-London.google.com [8.8.8.8]
The Significance of Hops
Hops are crucial elements in a Traceroute report. They represent the intermediary points data packets travel through on their way to the destination. By examining the number of hops and the time it takes to reach each one, you can identify network inefficiencies.
Example: Tracing a Route in Action
Imagine you’re experiencing a slow internet connection to a gaming server. By running a Traceroute, you can identify the problematic hop causing the latency. Let’s say you observe that the hop at IP address 192.168.1.1 has a much higher round-trip time compared to others. This indicates that the issue may be with your home router.
Here’s the CLI output of the Traceroute:
Tracing route to gaming-server.com [192.168.1.1]
over a maximum of 30 hops:

  1    <1 ms    <1 ms    <1 ms  your-router.local
  2    20 ms    19 ms    22 ms  isp-router.com
  3    50 ms    55 ms    48 ms  gaming-server.com
In this example, you can see that the second hop to “isp-router.com” has a relatively high latency, which is likely causing the slow internet connection.
Troubleshooting Network Issues
Traceroute is an invaluable tool for troubleshooting network issues. Whether you’re experiencing a slow internet or intermittent connectivity problems, a Traceroute can help you identify the source of the issue.
Example: Diagnosing Packet Loss
Let’s say you’re encountering frequent packet loss during online meetings. By running a Traceroute, you notice that multiple hops show packet loss. This suggests that the problem lies within your internet service provider’s network.
Here’s the CLI output of the Traceroute:
Tracing route to meeting-server.com [203.0.113.5]
over a maximum of 30 hops:

  1    <1 ms    <1 ms    <1 ms  your-router.local
  2    20 ms    19 ms    22 ms  isp-router.com
  3    *       *       *      Request timed out.
  4    45 ms    50 ms    48 ms  meeting-server.com
In this example, the asterisks (*) in the third hop indicate packet loss, which is causing the disruptions in your online meetings.
Traceroute and Its Practical Applications
Traceroute goes beyond mere curiosity. It’s a tool used by network administrators to diagnose and resolve connectivity problems, ensuring smooth data flow. Discover how this tool plays a pivotal role in maintaining the efficiency of the internet.
Example: Network Optimization
A company’s IT department uses Traceroute to optimize their network. By analyzing Traceroute results, they identify bottlenecks in their internal network, leading to faster data transmission.
Interpreting Traceroute Results
Interpreting the results of a Traceroute is essential for identifying network issues. Each line in the Traceroute report represents a hop. You’ll see IP addresses, round-trip times, and, in some cases, domain names. A high round-trip time may indicate network congestion or latency. Multiple asterisks (*) in a row suggest packet loss.
Example: Latency Troubleshooting
During an online gaming session, you notice increased lag. Running a Traceroute reveals that one of the hops is experiencing high latency. This indicates a network issue at that specific point.
Here’s the CLI output of the Traceroute:
Tracing route to gaming-server.com [192.168.1.1]
over a maximum of 30 hops:

  1    <1 ms    <1 ms    <1 ms  your-router.local
  2    20 ms    19 ms    22 ms  isp-router.com
  3    *       *       *      Request timed out.
  4    90 ms    85 ms    92 ms  gaming-server.com
In this example, the high round-trip time at the fourth hop is causing the increased lag during the gaming session.
Conclusion
Tracing a route with Traceroute is a journey of discovery. It empowers you to uncover the secrets of data transmission and diagnose network problems. Whether you’re a casual user or a tech enthusiast, this tool brings the digital world closer to your understanding.
Tables
Table 1: Traceroute CLI Outputs
| Hop | IP Address | Round-Trip Time (ms) |
|---|---|---|
| 1 | your-router.local | <1 |
| 2 | isp-router.com | 20-22 |
| 3 | gaming-server.com | 45-55 |
Table 2: Troubleshooting Network Issues
| Issue | Traceroute Output | Possible Cause |
|---|---|---|
| Slow Internet | High Round-Trip Time at an Intermediate Hop | Network Congestion |
| Packet Loss | Multiple Asterisks (*) at Intermediate Hops | Connectivity Issues |
| High Latency | High Round-Trip Time at a Specific Intermediate Hop | Network Congestion or Latency |
FAQs
1. What is Traceroute used for?
Traceroute is primarily used for diagnosing network issues and understanding the path data takes across the internet.
2. How does Traceroute work?
Traceroute works by sending packets with incrementally increasing Time-to-Live values, revealing the path data takes and any network issues.
3. How can I run Traceroute on a Cisco router?
In a Cisco router, use the “traceroute” command followed by the target IP or domain to run Traceroute.
4. How can I run Traceroute in Windows CLI?
In the Windows Command Prompt, use the “tracert” command followed by the target IP or domain to run Traceroute.
5. What should I look for in Traceroute results?
Pay attention to round-trip times, IP addresses, and the number of asterisks, as these elements can reveal network issues.